Menu
Open
Close
Barcelona [ Spain ]mmoulian@manuelamoulian.com+34 656 39 0049

About
What makes a visualization memorable?
“In human cognition, understanding and memorability are intertwined.” (Borkin, M. et al.)
From this first condition, we in Númerica, work on impact and effectiveness.
Our services
Creative process
01. CLIENT BRIEFING
The project begins by listening and understanding the client. Then we are ready to write our own creative vision.
02. DATA ANALYSIS
We explore and edit the data to start creating visualizations.
03. OUTLINE
Using different charts and diagrams we see how the story behind the data is better communicated.
04. DESIGN
We use all our design knowledge to make the experience with the information meaningful and memorable.


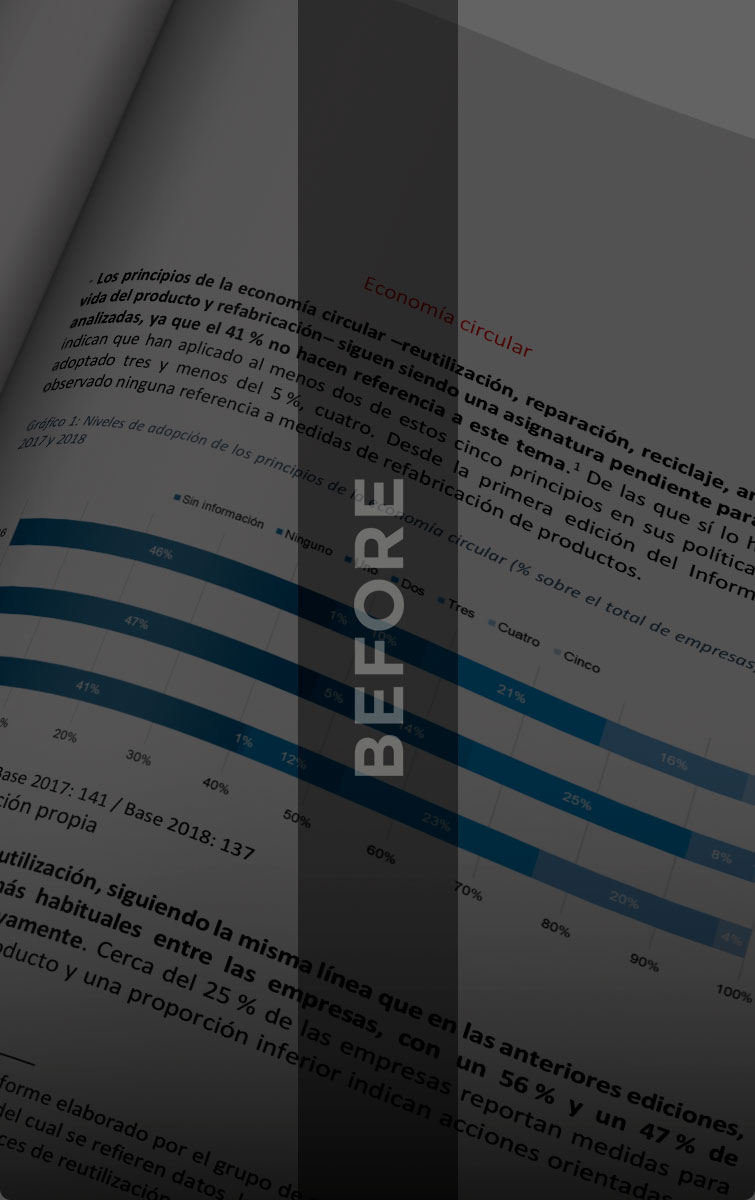
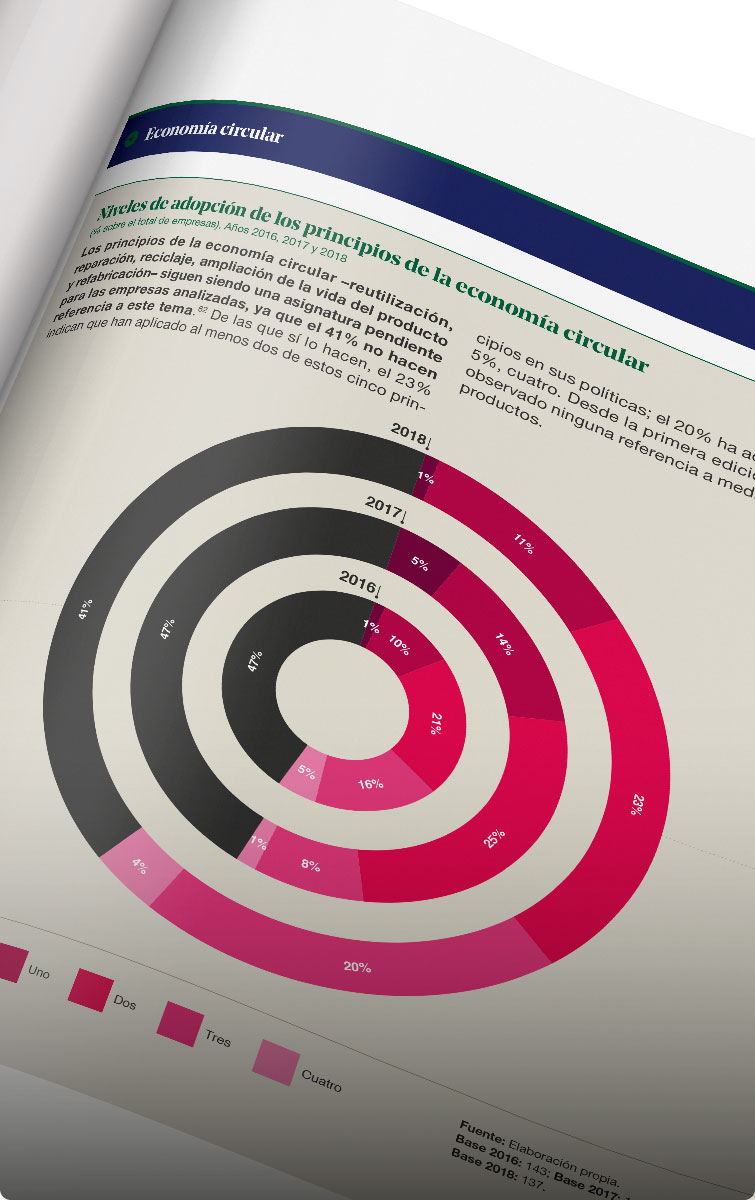
Before and after
Every graph is simple compared to the database it represents, but often not effective enough. If complex information is not designed correctly it could be misunderstanding.
Most important is the story behind the numbers. We read, research and interpret the data surrounding each project to find the best possible concept to structure the information. Once we understand the main focus, we delve into the design to optimize every element. We explore various charts to find the best visual expression to show the message and we decided which other elements will help us to tell all story (text, image, highlight figures, maps, diagrams, etc.)


