Numérica
loading...
ELKANODATA AGENCY
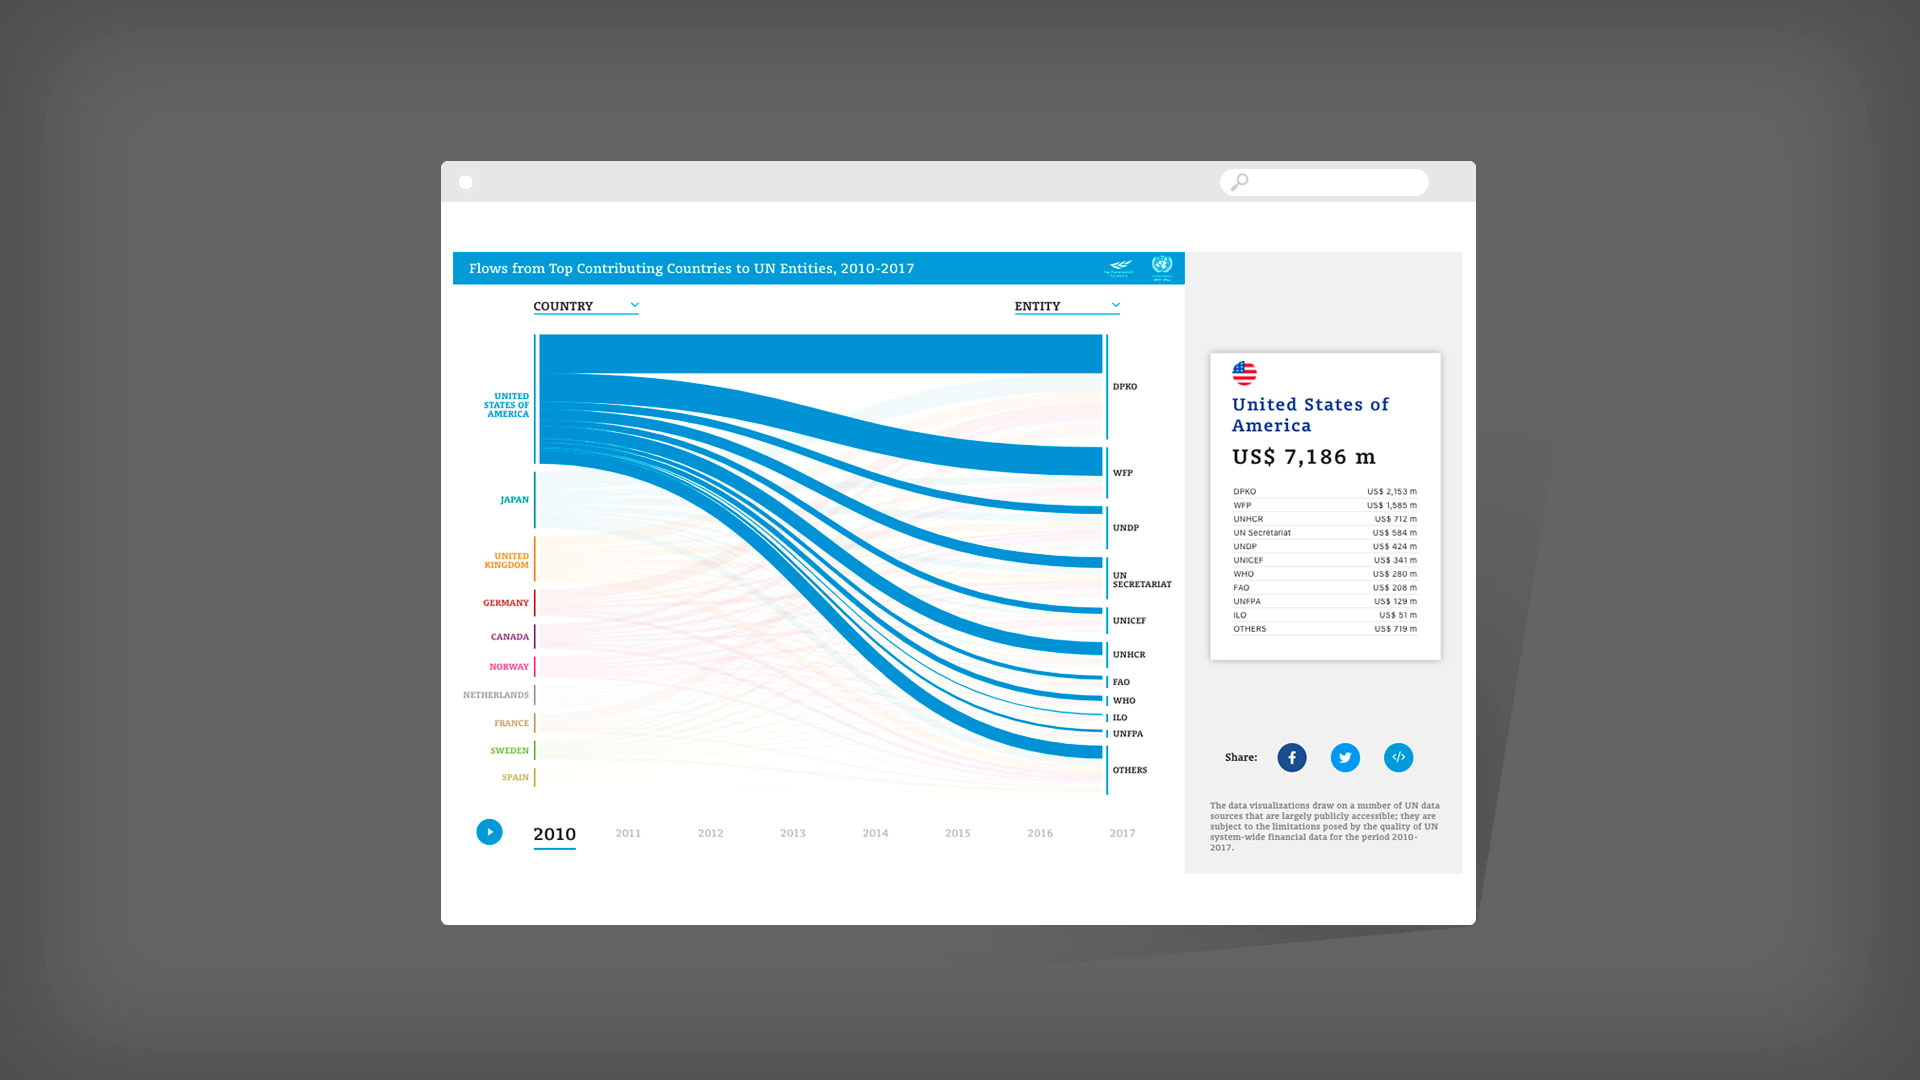
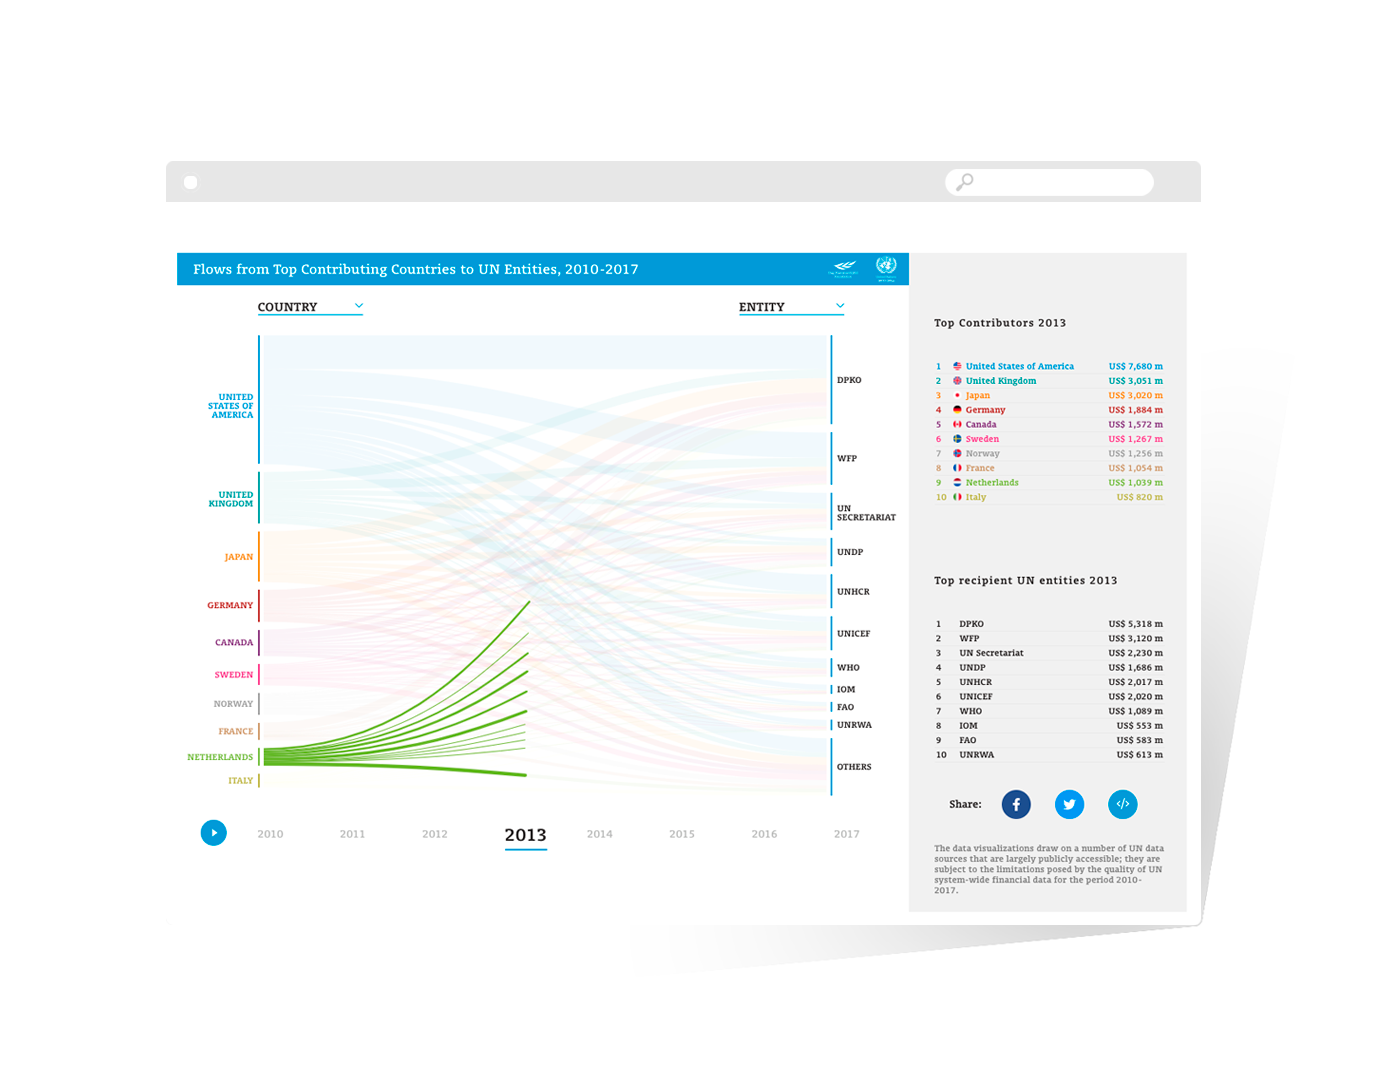
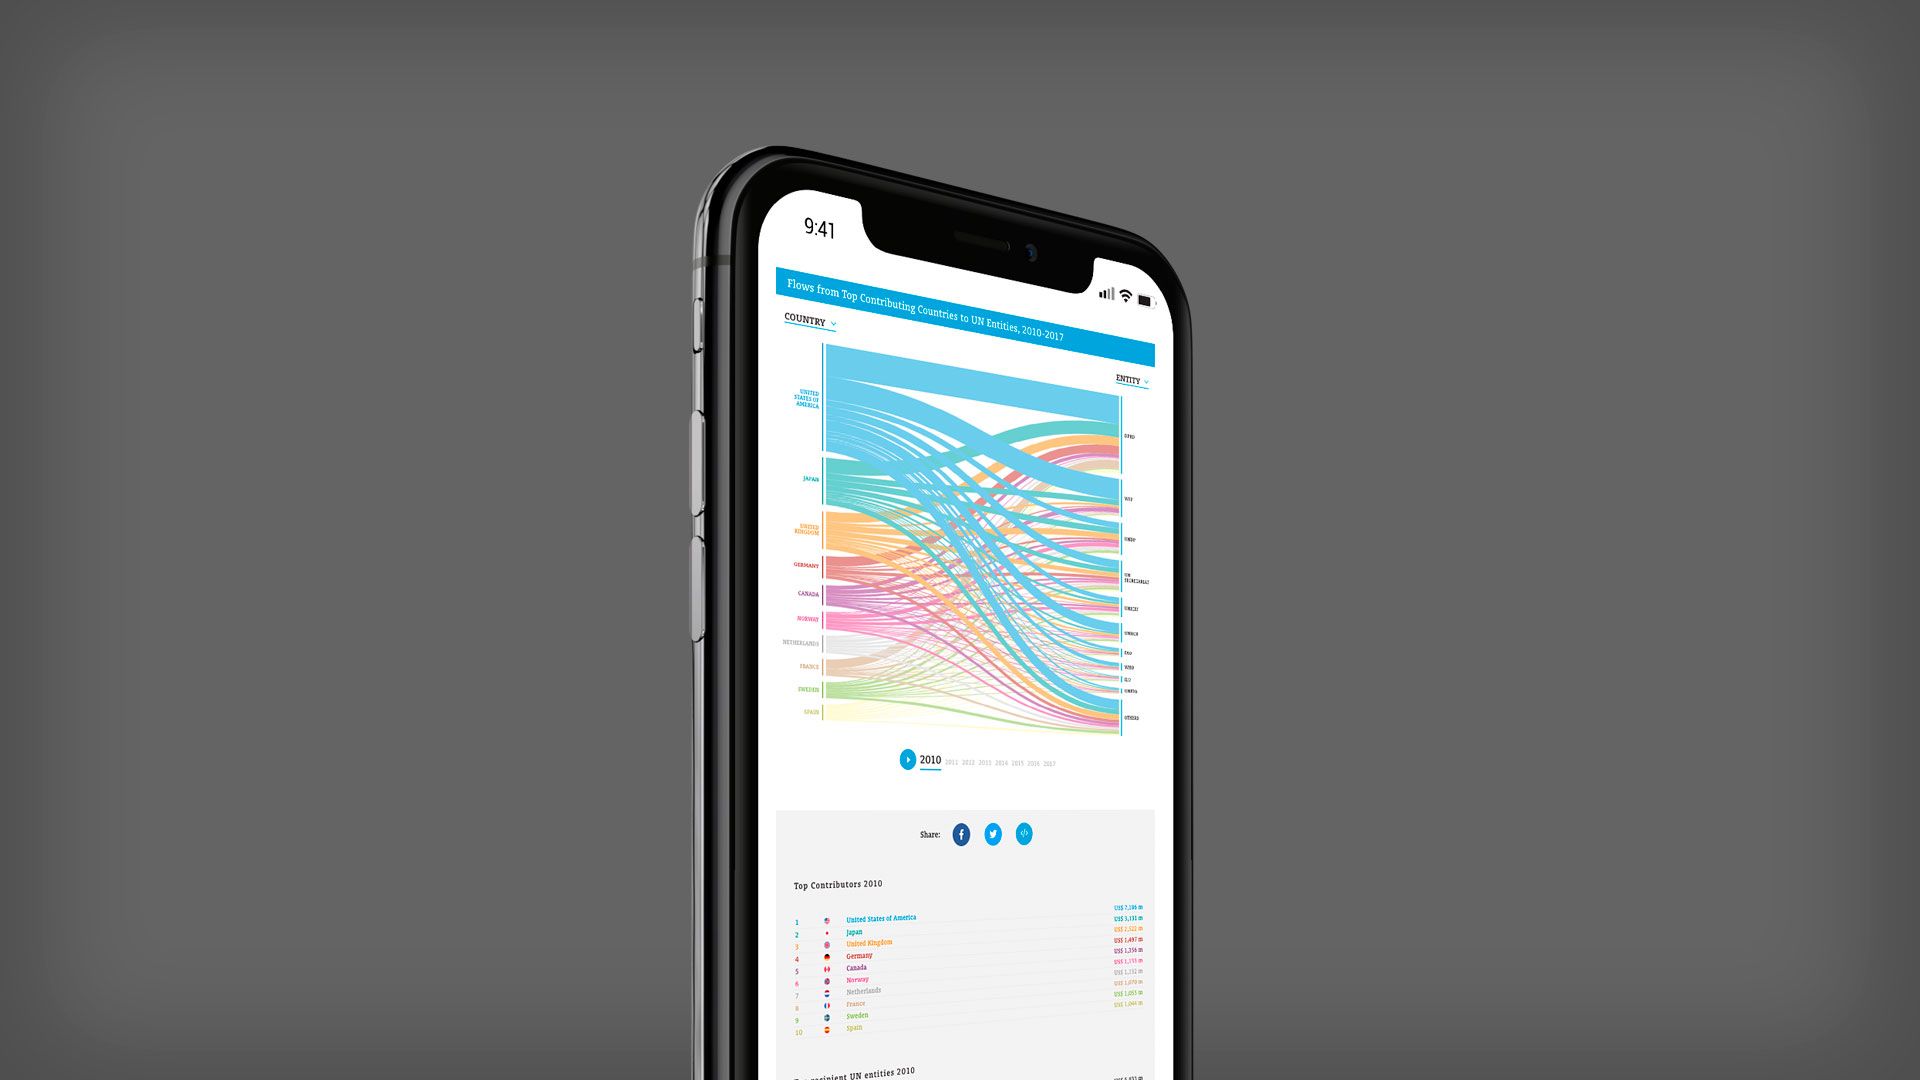
Visualization of Government contributions to UN Agencies
This project is a collaboration for the Elkanodata Agency.
 
The client, United Nations MPTF office, needed to interactively visualize the flow of funds from the government contributor to the various receiving UN agencies.
UN-MPTF2d

Interactive Data

The idea of the briefing was to do it with two opposed bar charts. We proposed Sankey diagram, because this chart link different concepts and the width of its lines is proportional to the data flow rate.
 

The interactivity of the chart allows one to look at the details of each contributing government and each receiving agency, and browse easily through the different years of information.

UN-MPTF1d
UN-MPTFfono
VIEW
CLOSE