
About
What makes data visualization memorable?
“In human cognition, understanding and memorability are intertwined.” (Borkin, M. et al.)
This principle guides us to create data visualizations and information design with impact, clarity, and effectiveness.
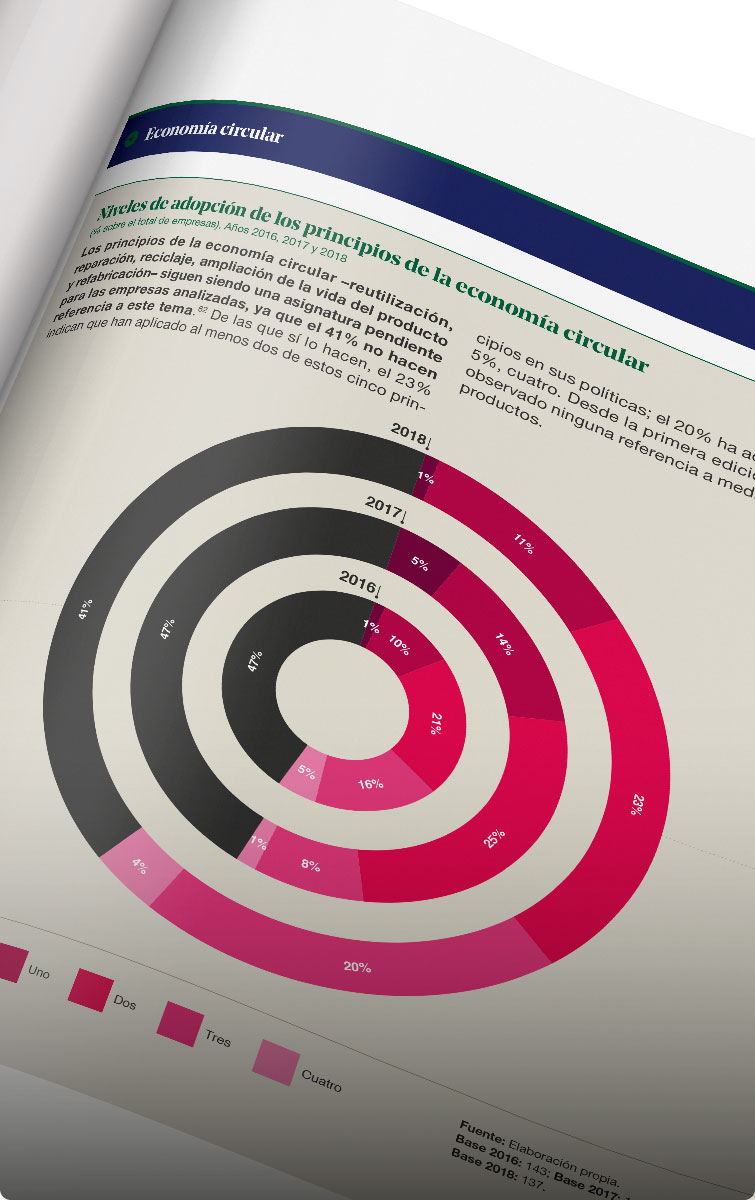
Before and after
Every data visualization is simple compared to the database it represents, but often not effective enough. If complex information is not designed by a professional it could be misunderstanding.
Most important is the story behind the numbers. We analyze, research and interpret the data surrounding each project to find the best possible concept to structure the information.
Once we understand the main focus, we delve into the information design to optimize every element. We explore various charts and infographics to find the best visual expression to show the message and we decided which other elements will help us to tell the full story (text, image, highlight figures, maps, diagrams, etc.).