Barcelona [ Spain ]mmoulian@manuelamoulian.com+34 656 39 0049
Information Design
Visual Stories
As a designer, I’ve always been interested in uncovering the story behind the information—especially when working with complex data, reports, or topics that might initially seem difficult to visualize.
That’s why I’ve started a series of personal explorations into storytelling, data, and design.
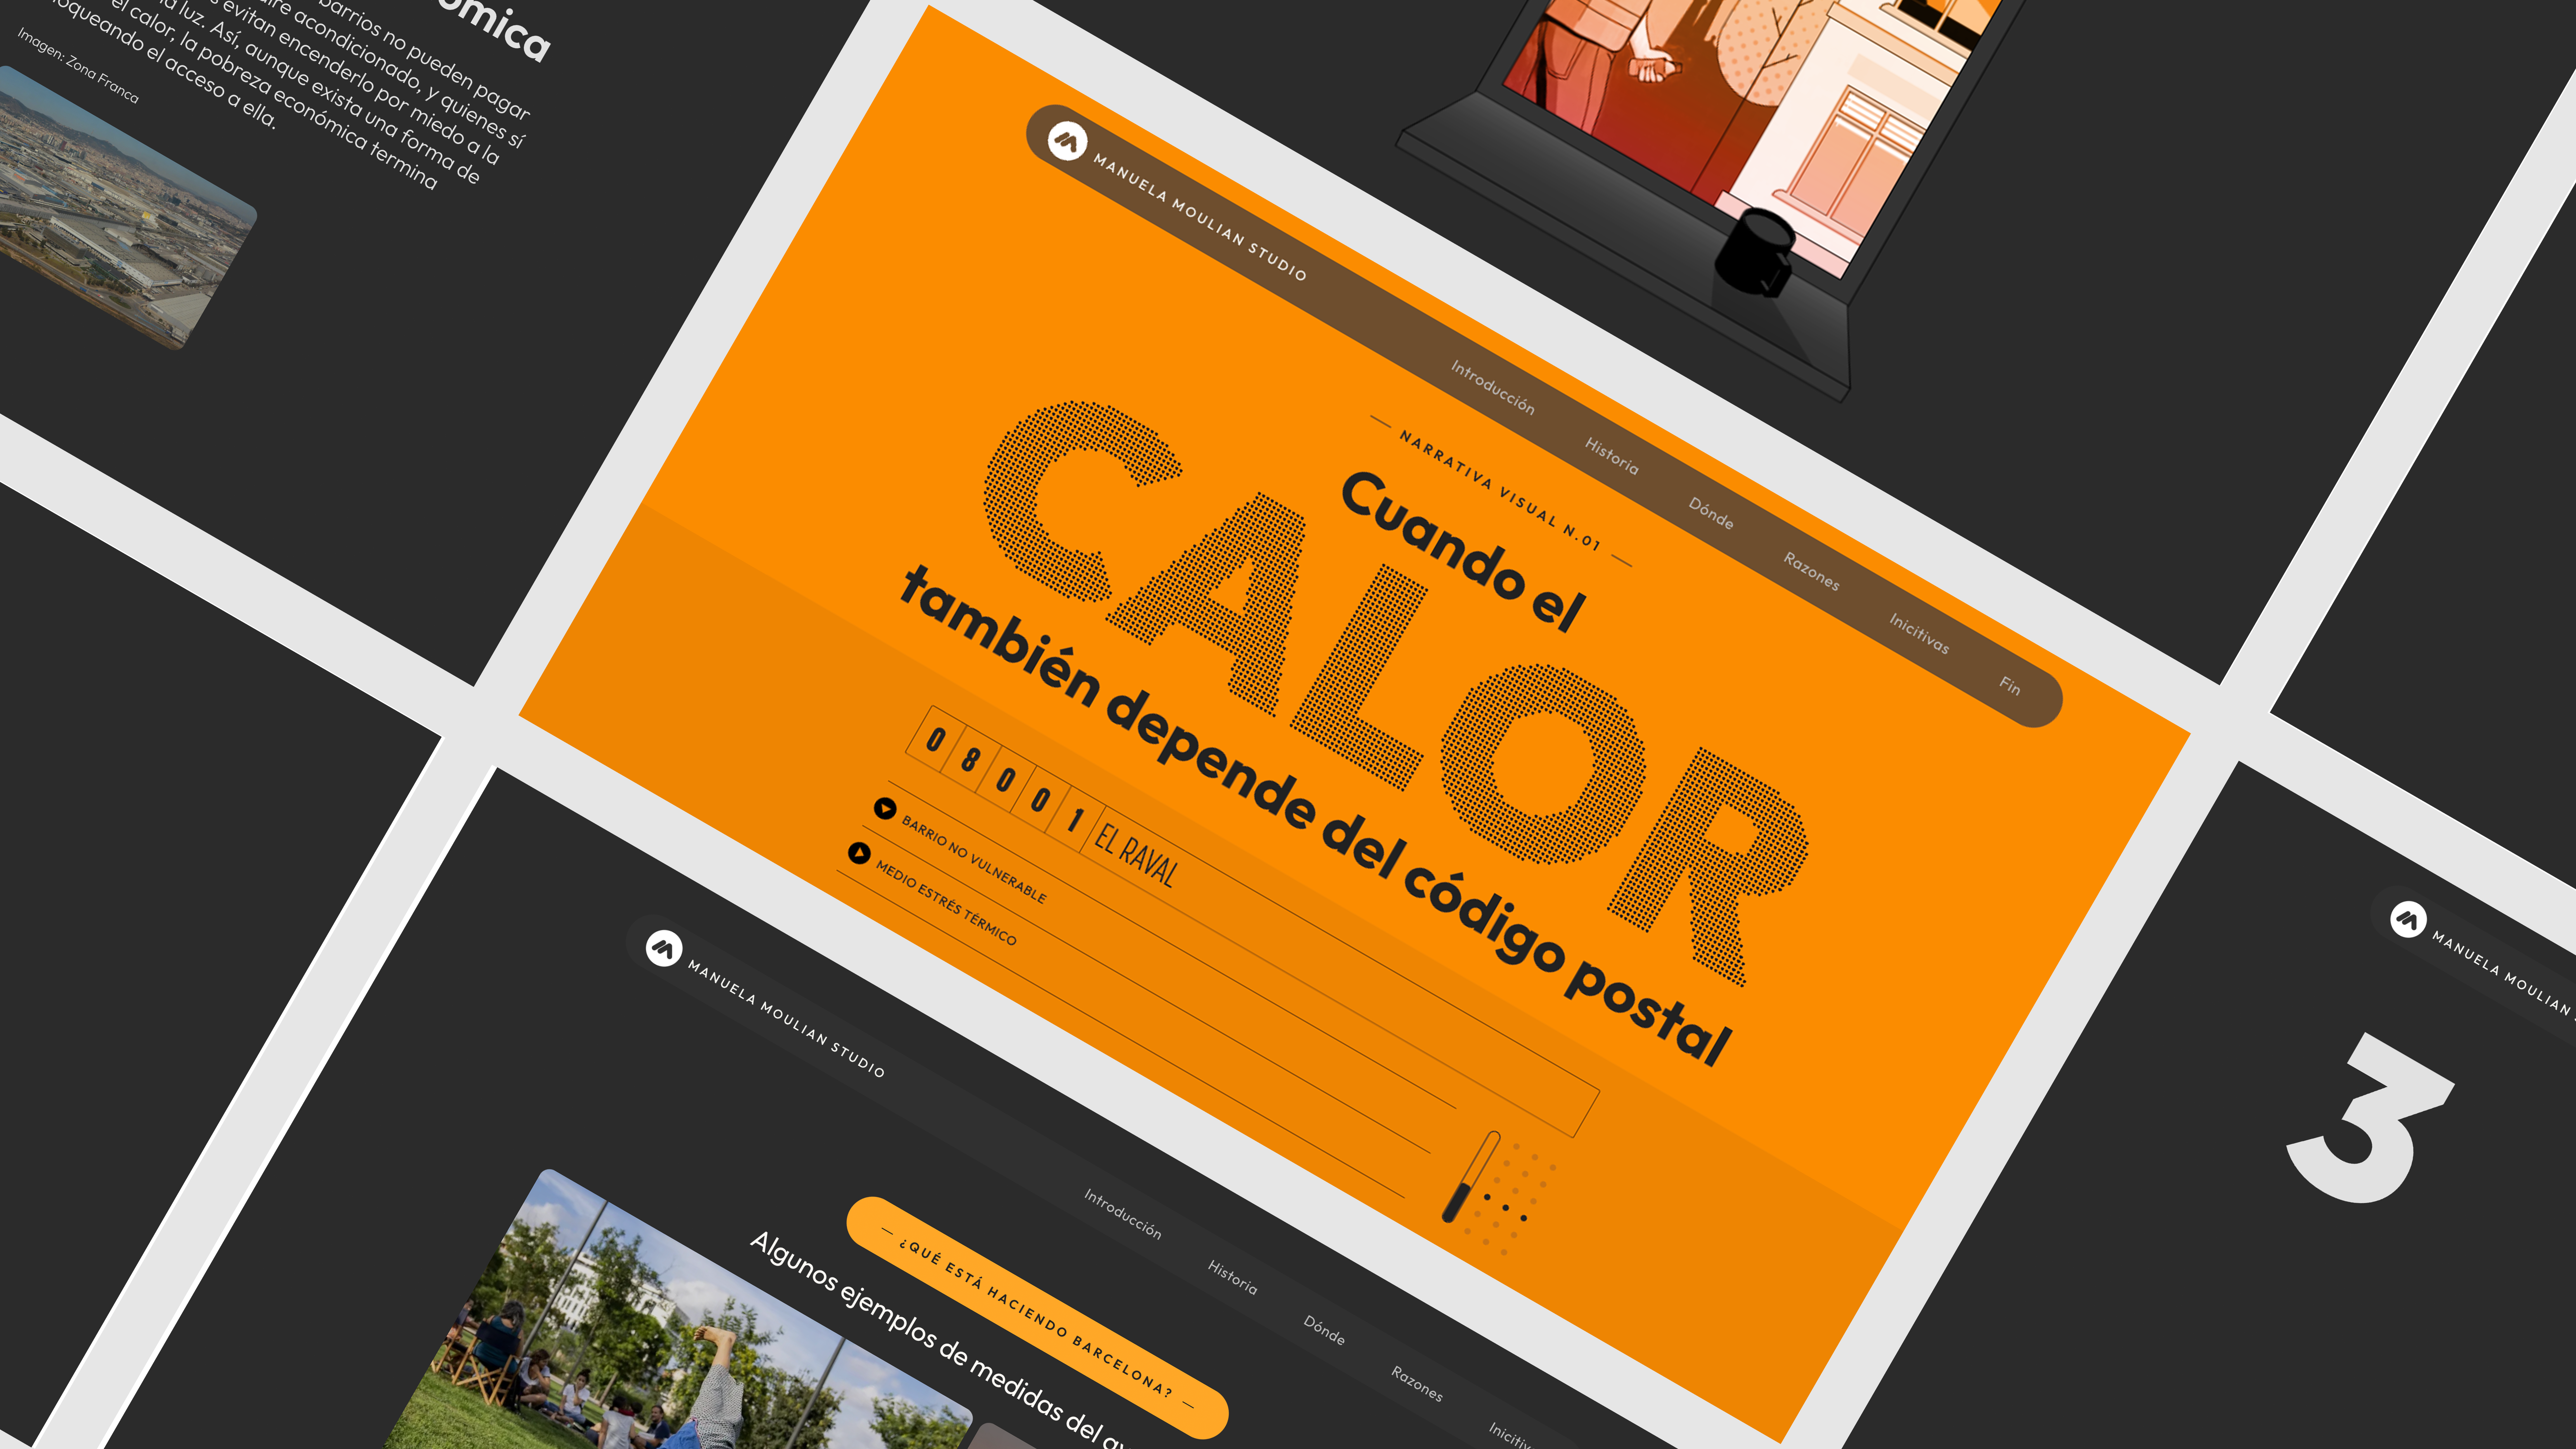
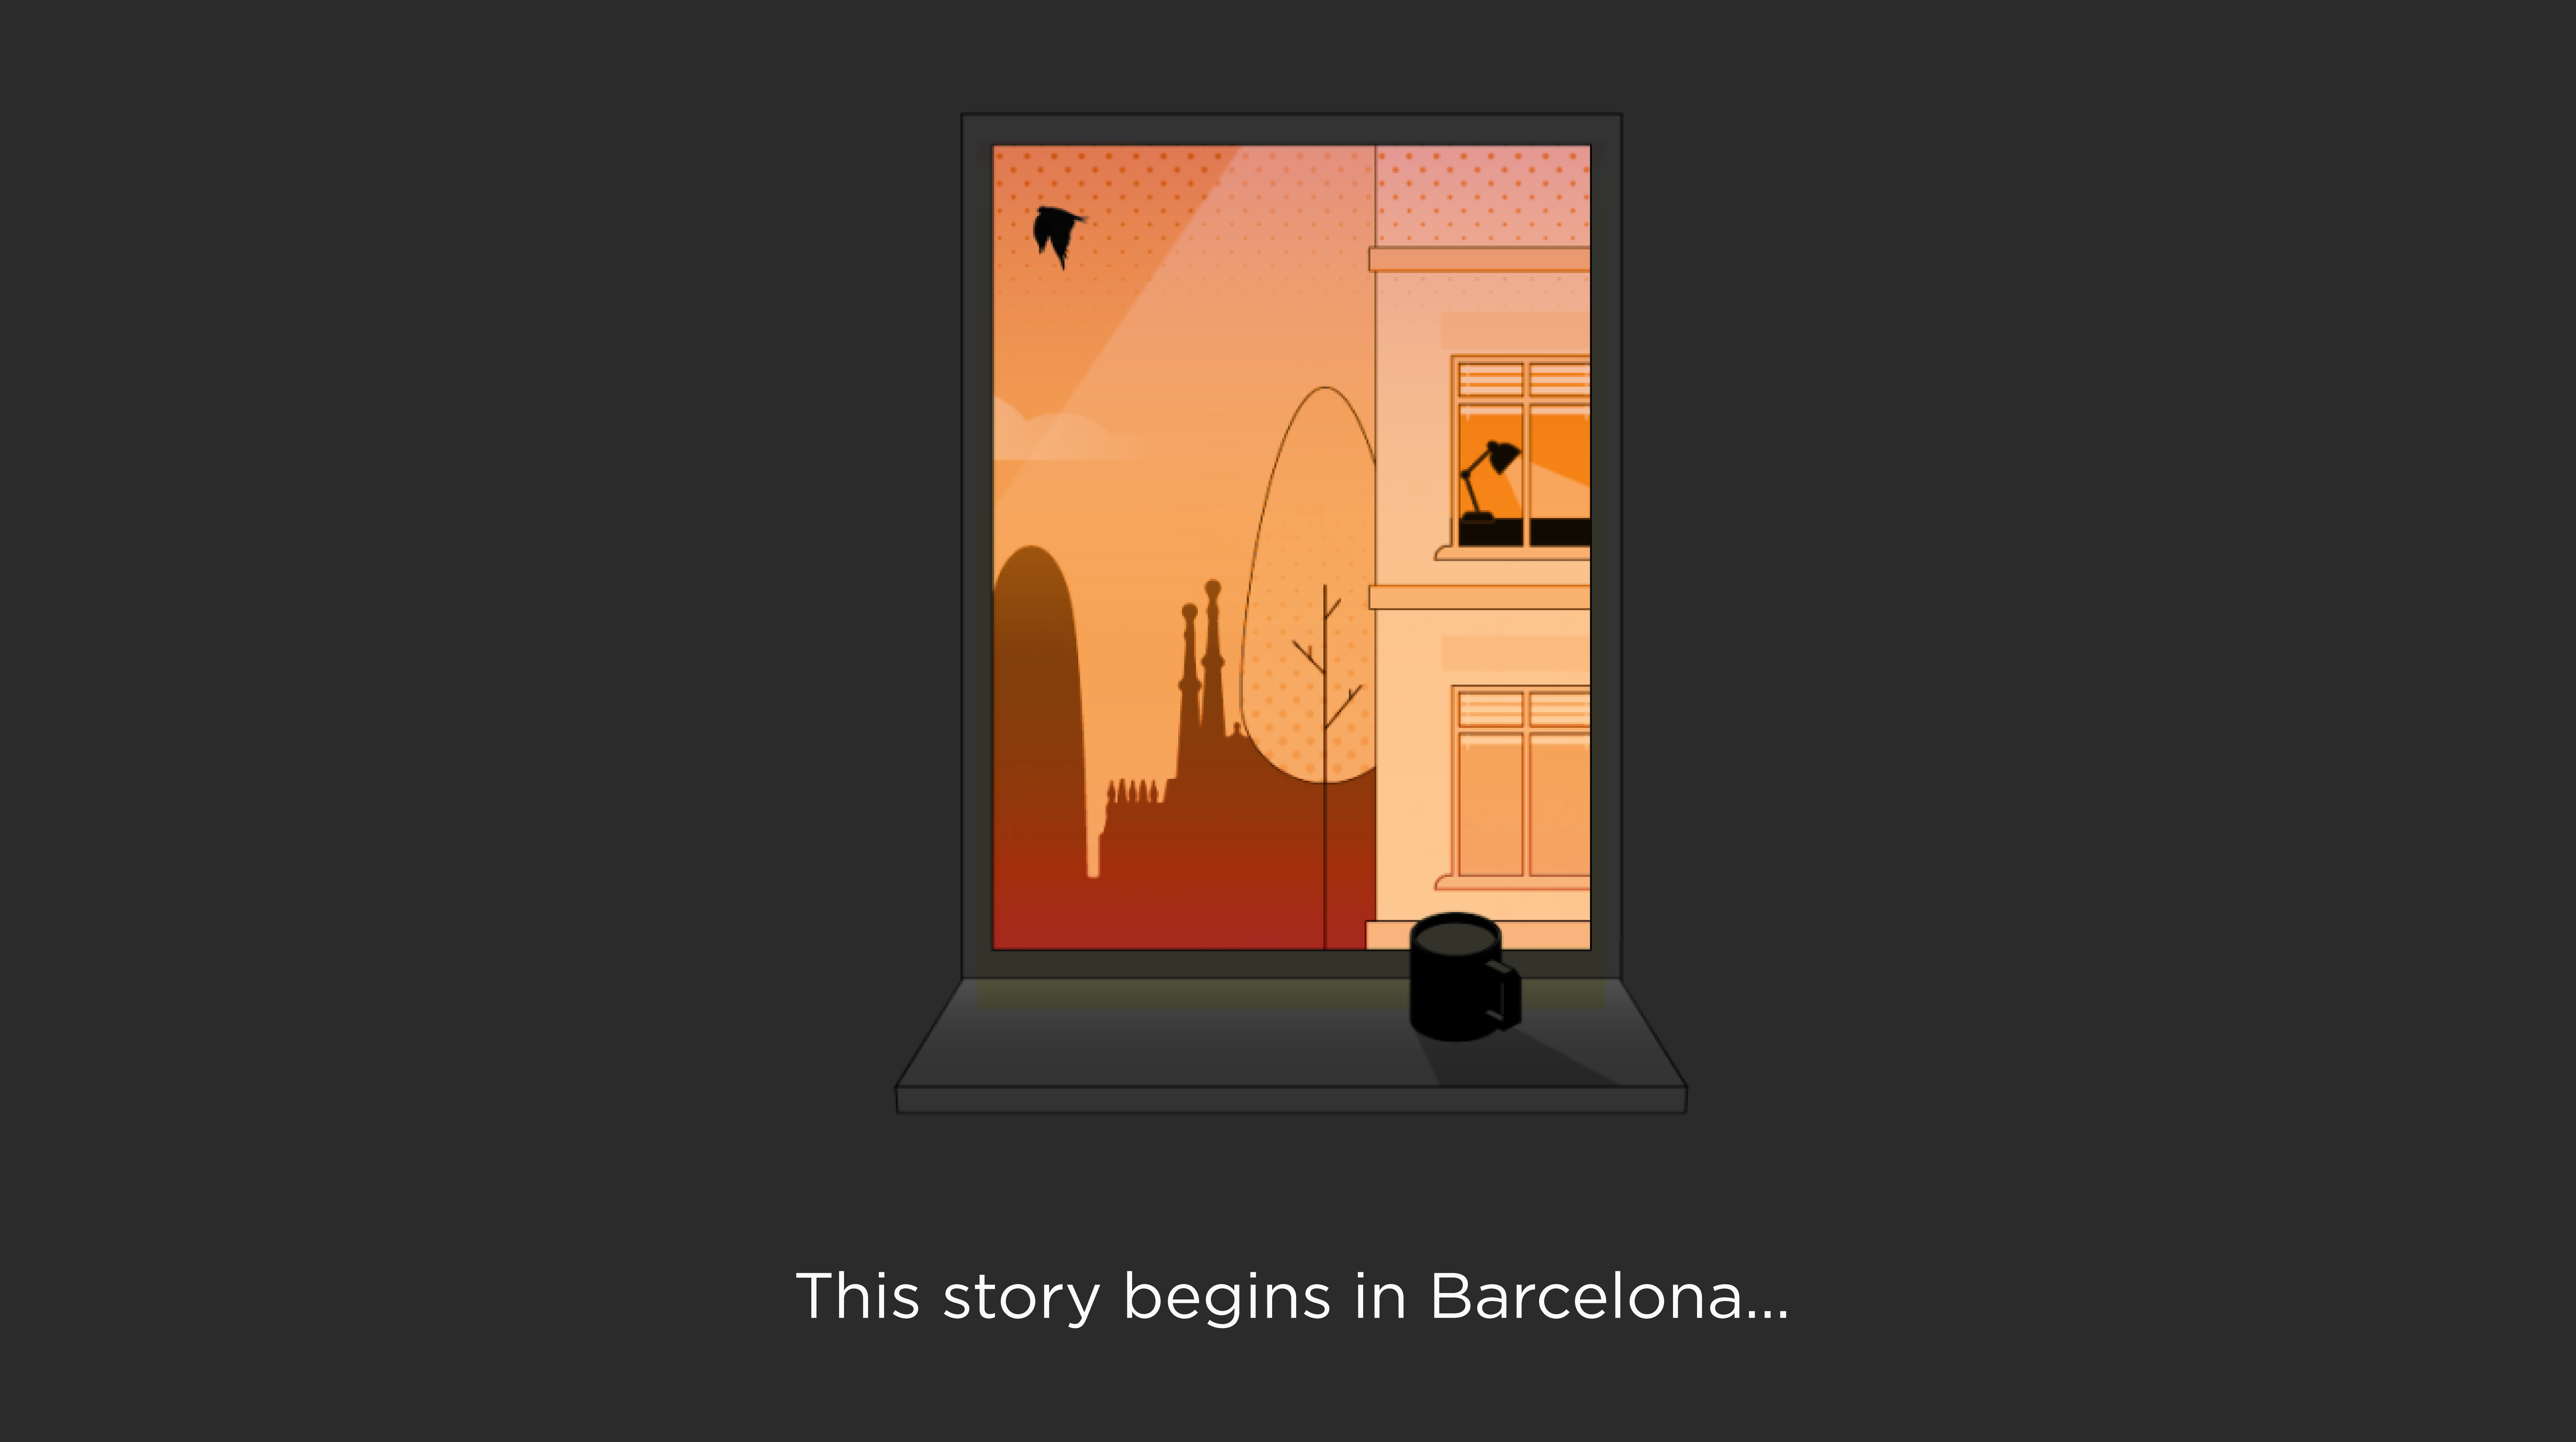
It starts with something very close to home: heat in Barcelona.
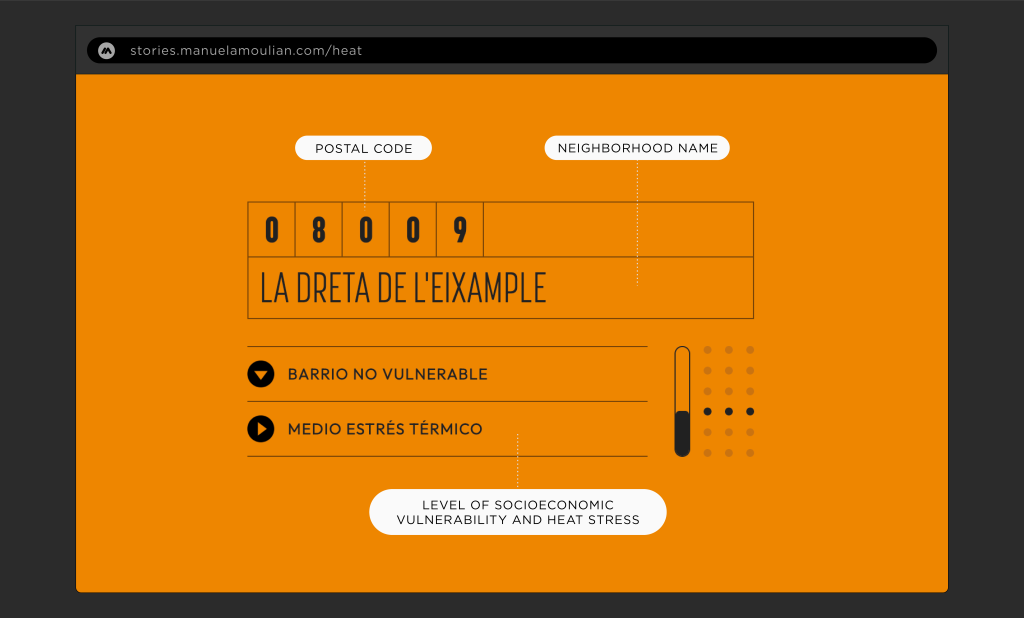
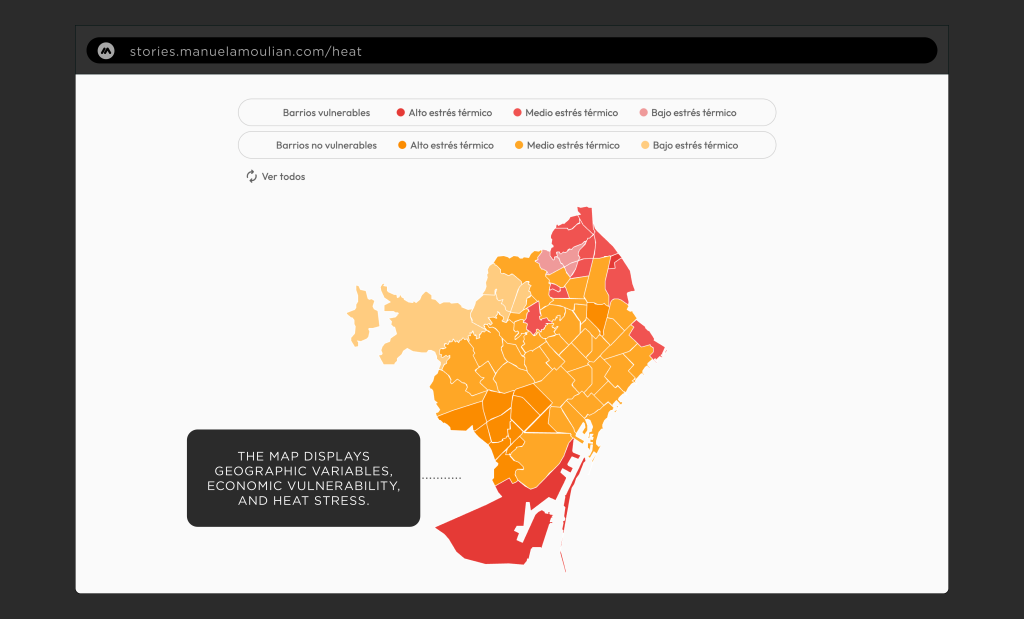
I’ve cross-referenced socioeconomic vulnerability data with heat-stress data to explore how combining different datasets can reveal new connections—and help us tell a story about the city and how we experience it.
Heat stress and socioeconomic vulnerability
Heat Stress
SocioeconomicVulnerability
Based on research by the Institute of Governance and Public Policies (IGOP) of the
Autonomous University of Barcelona, cited in an article published by La Vanguardia
I didn’t want to create just another data visualization.
I wanted to experiment with how
a narrative can emerge from the data itself.