Manuela Moulian Studio
loading...
SELF PROJECT
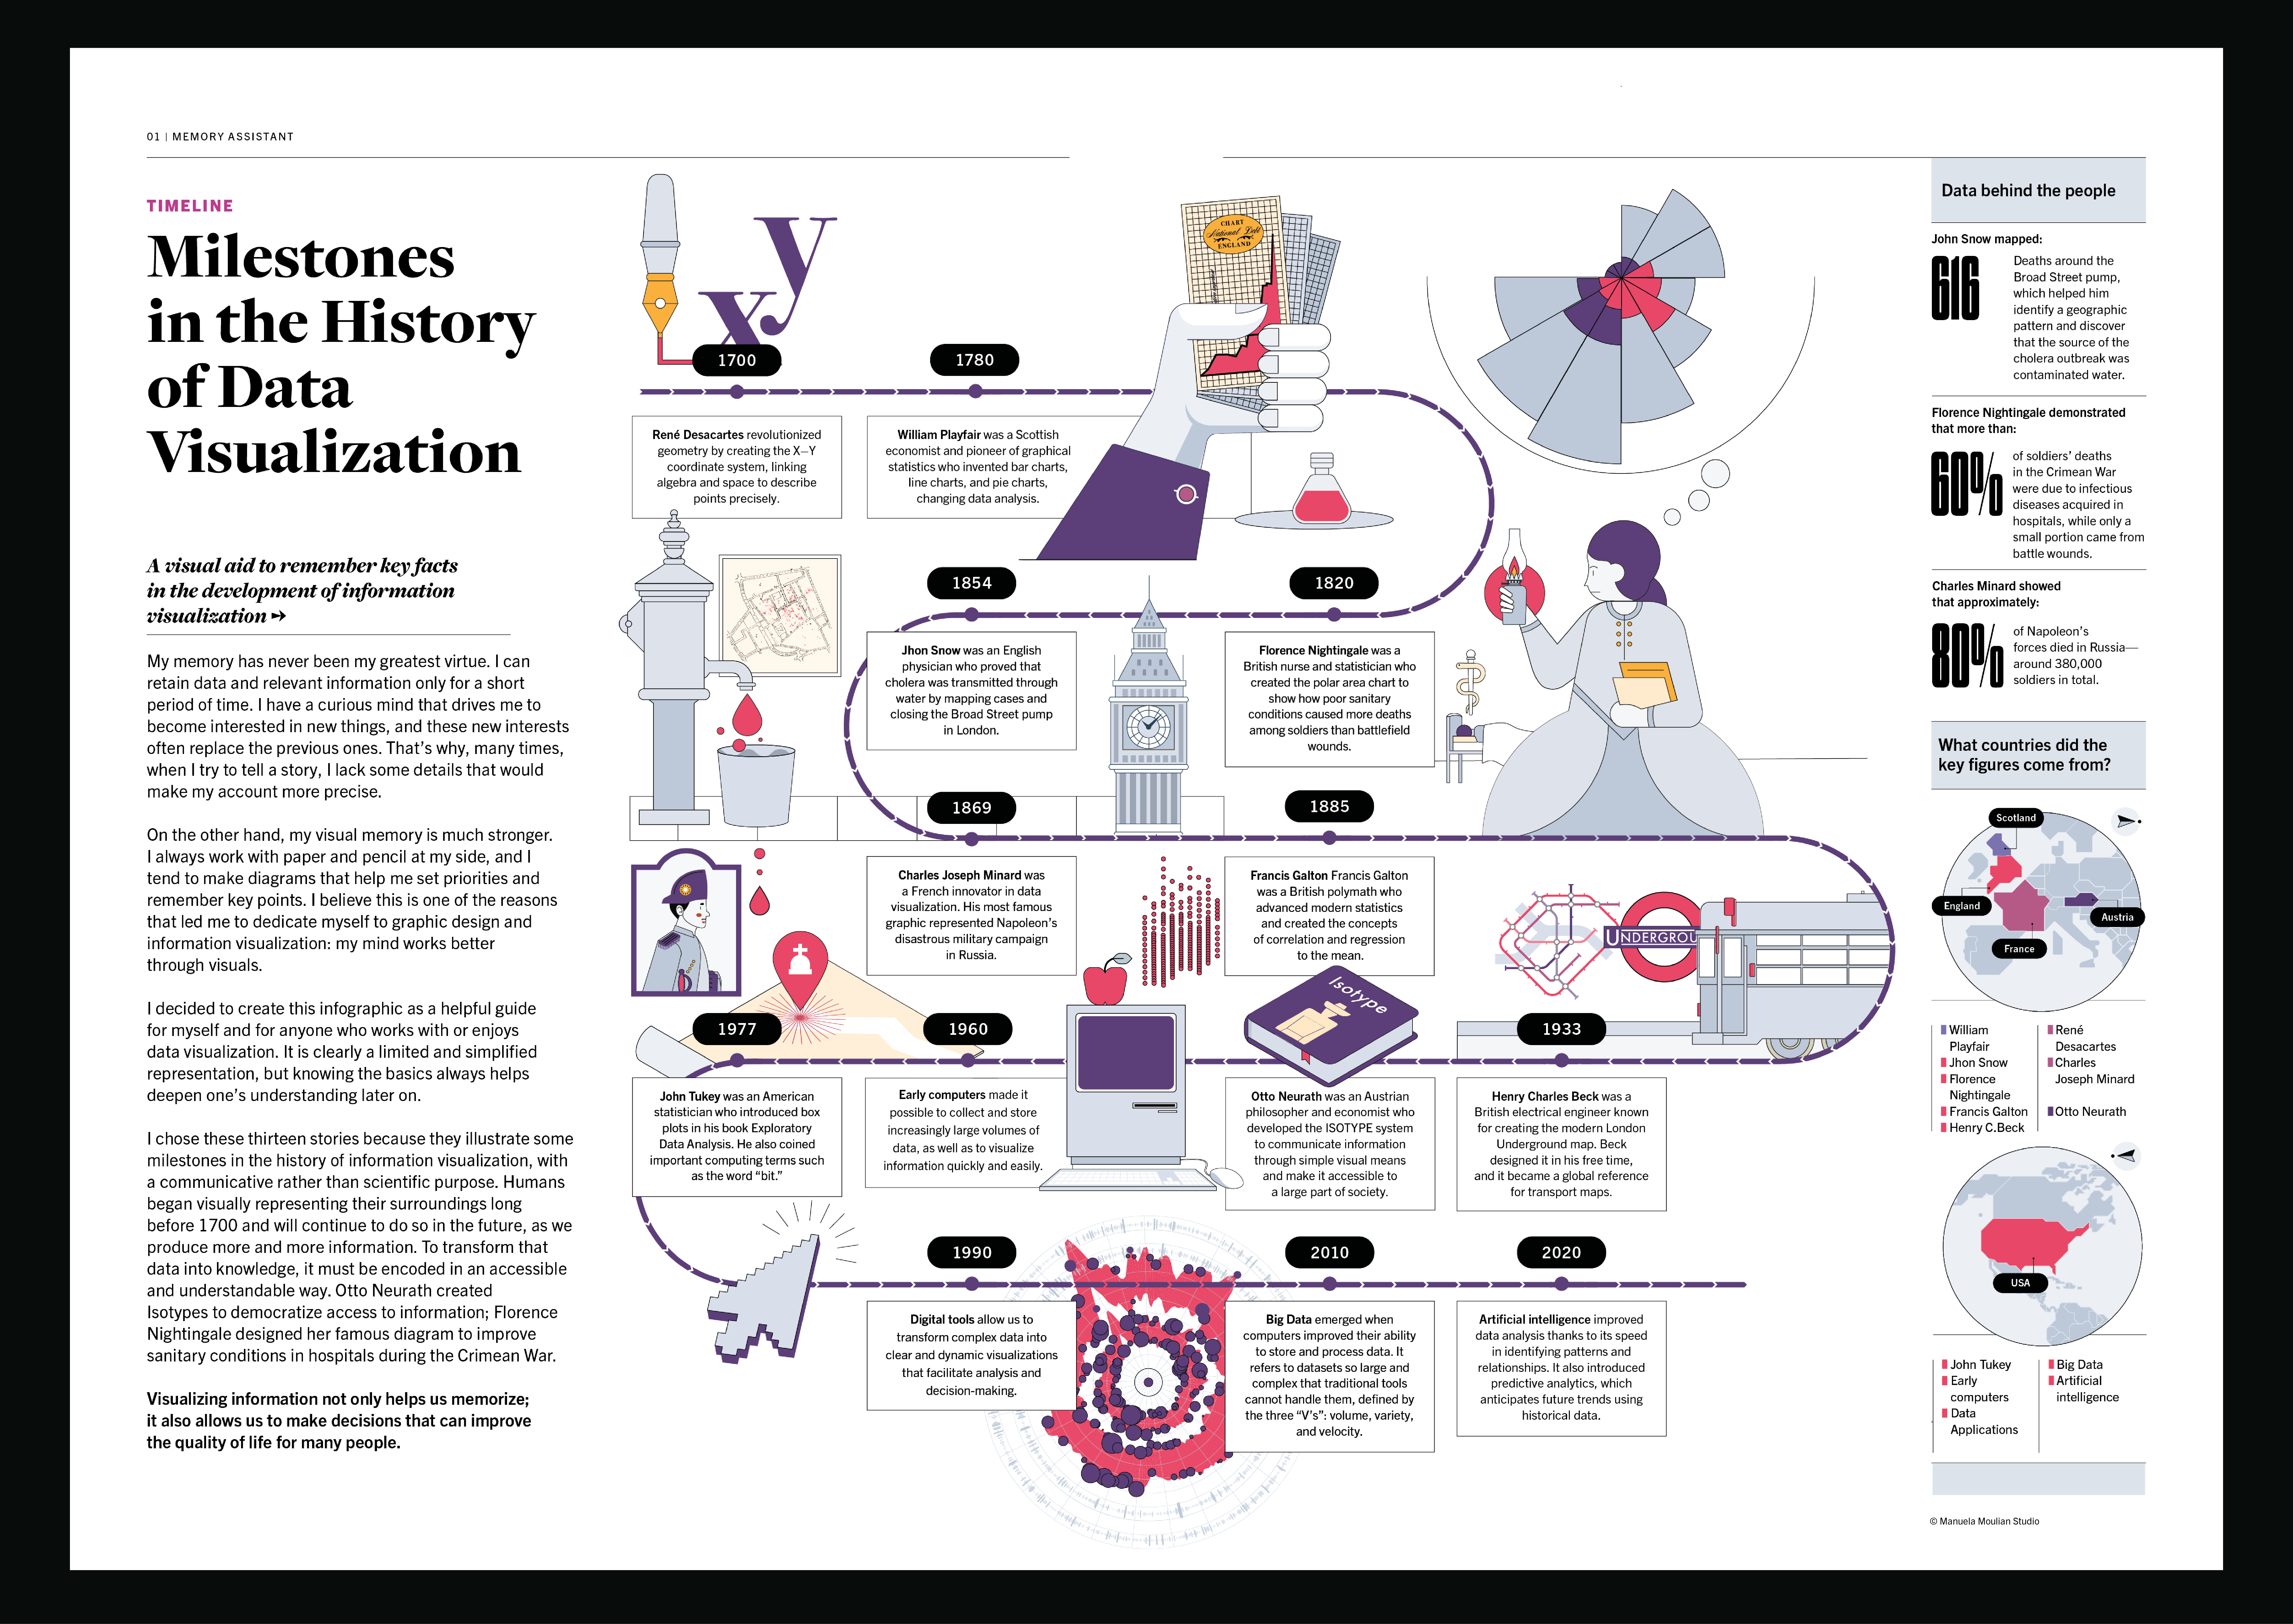
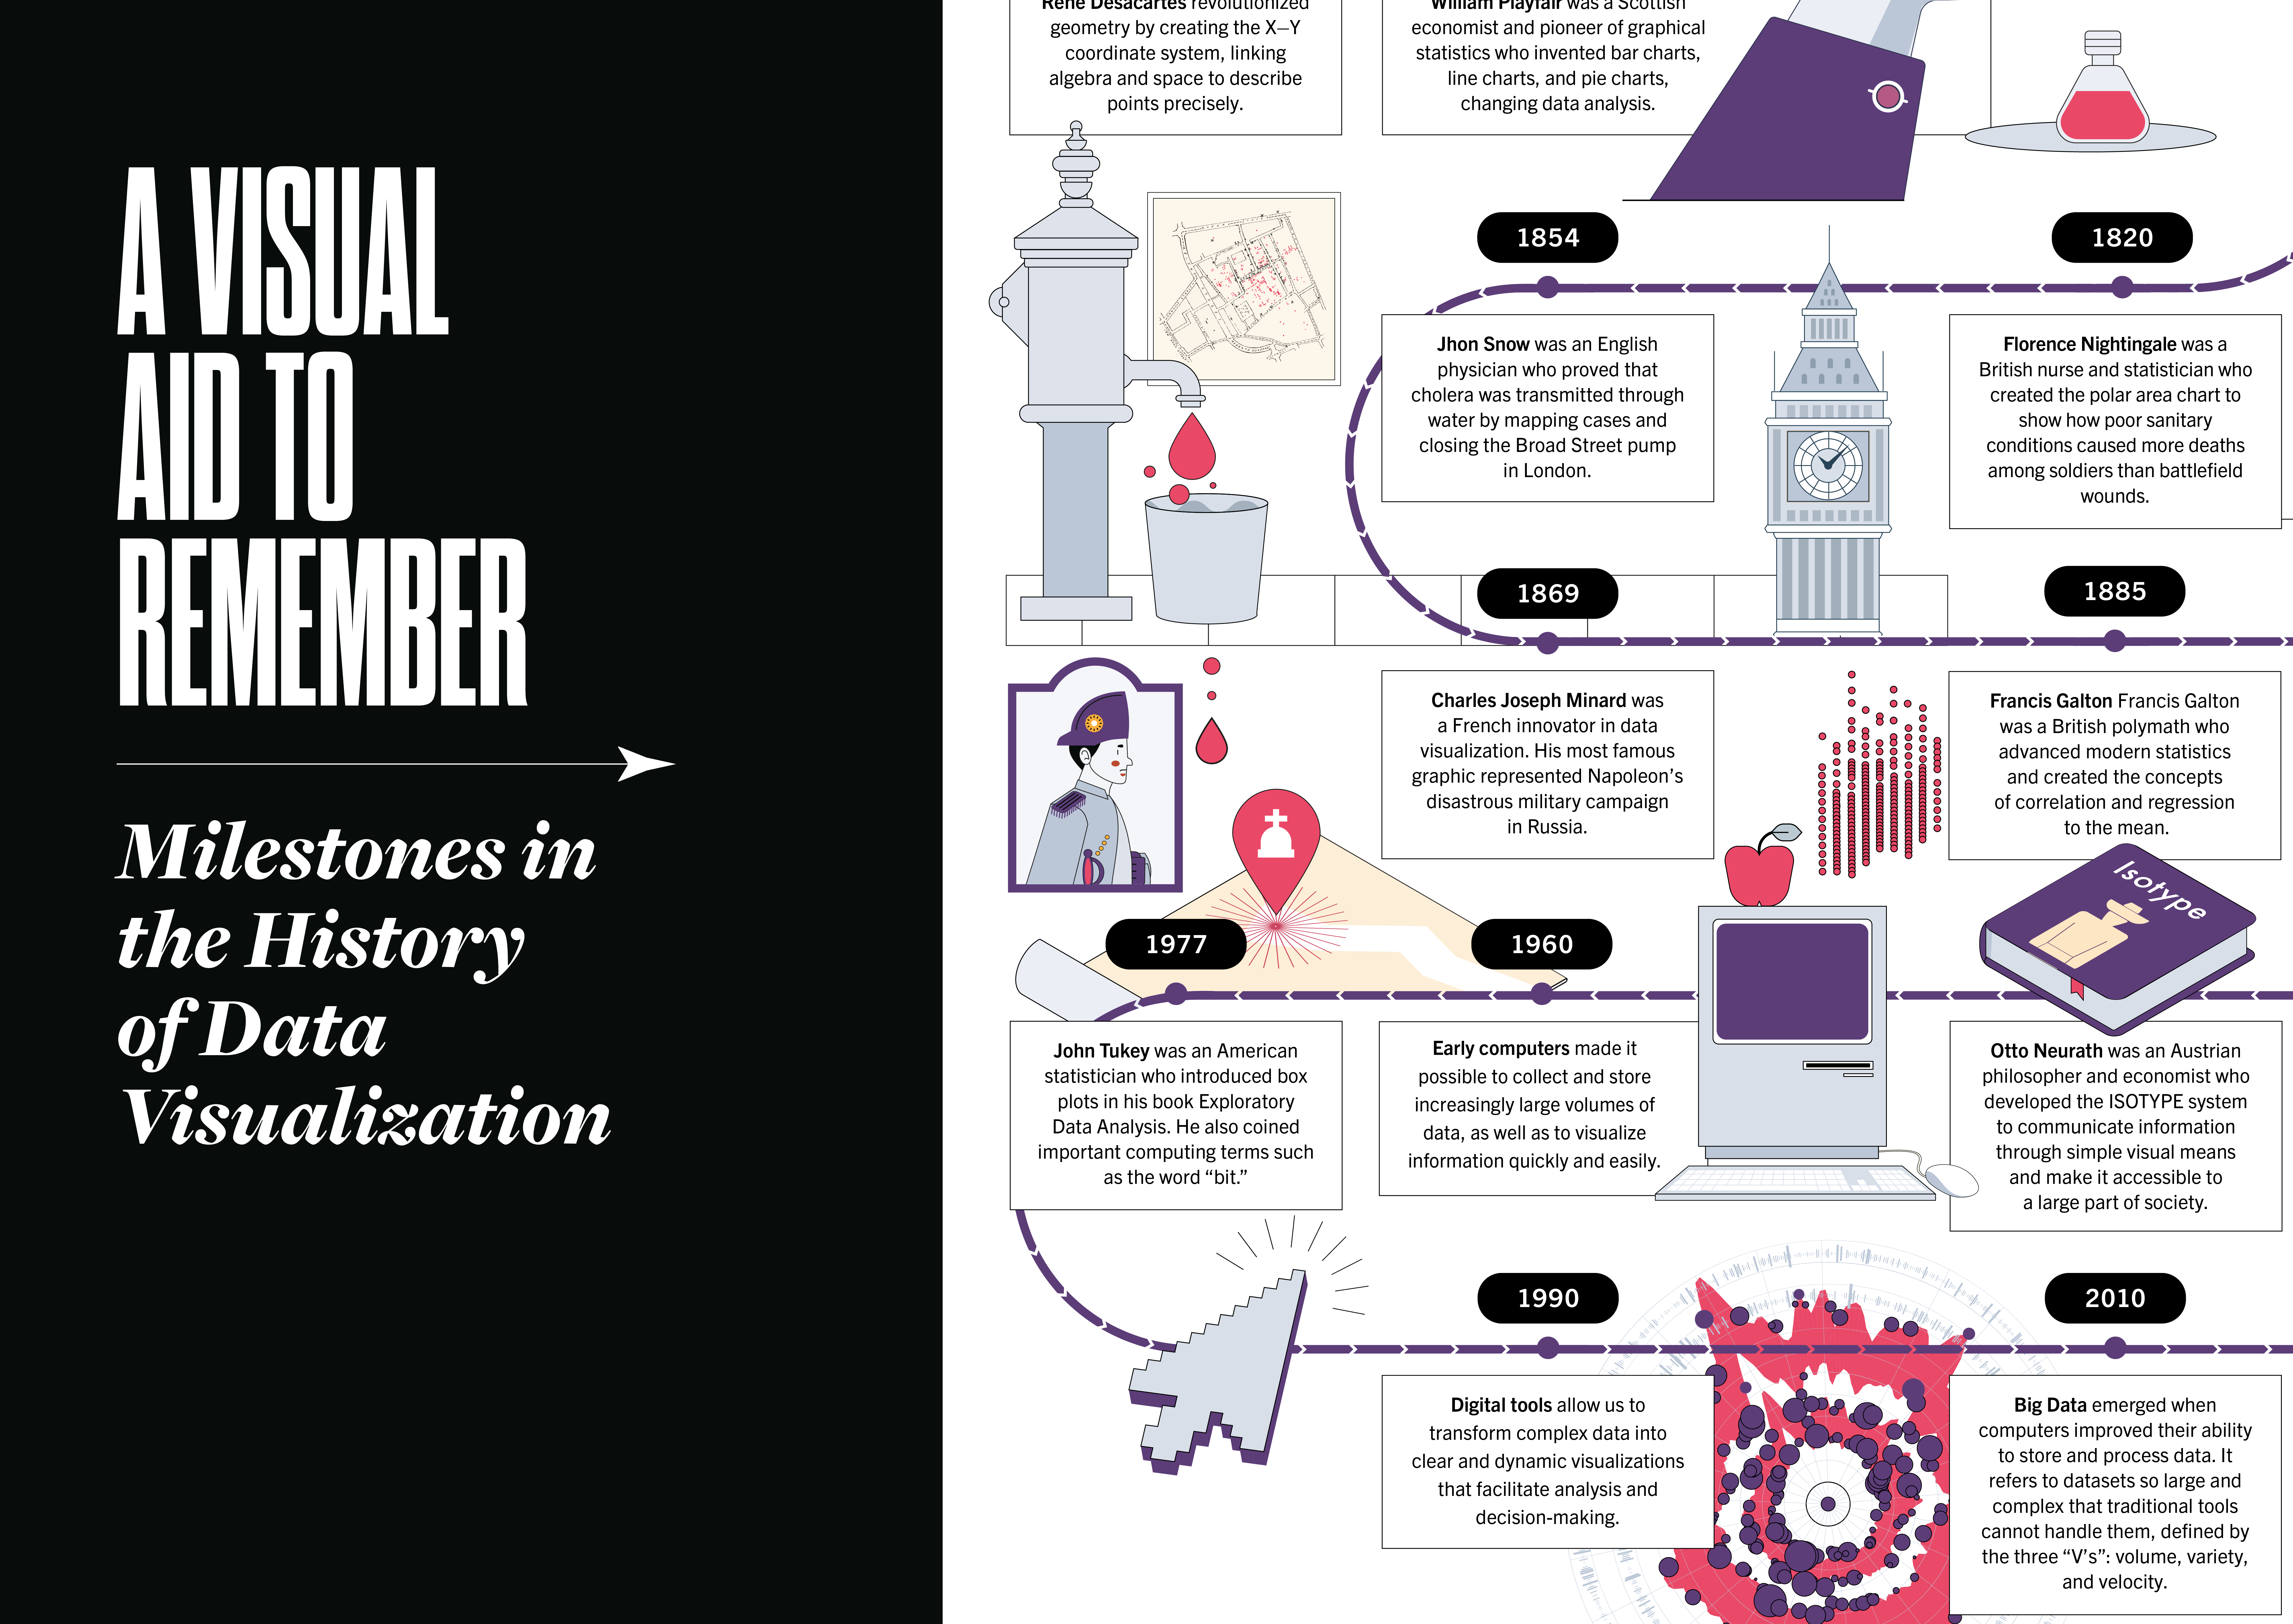
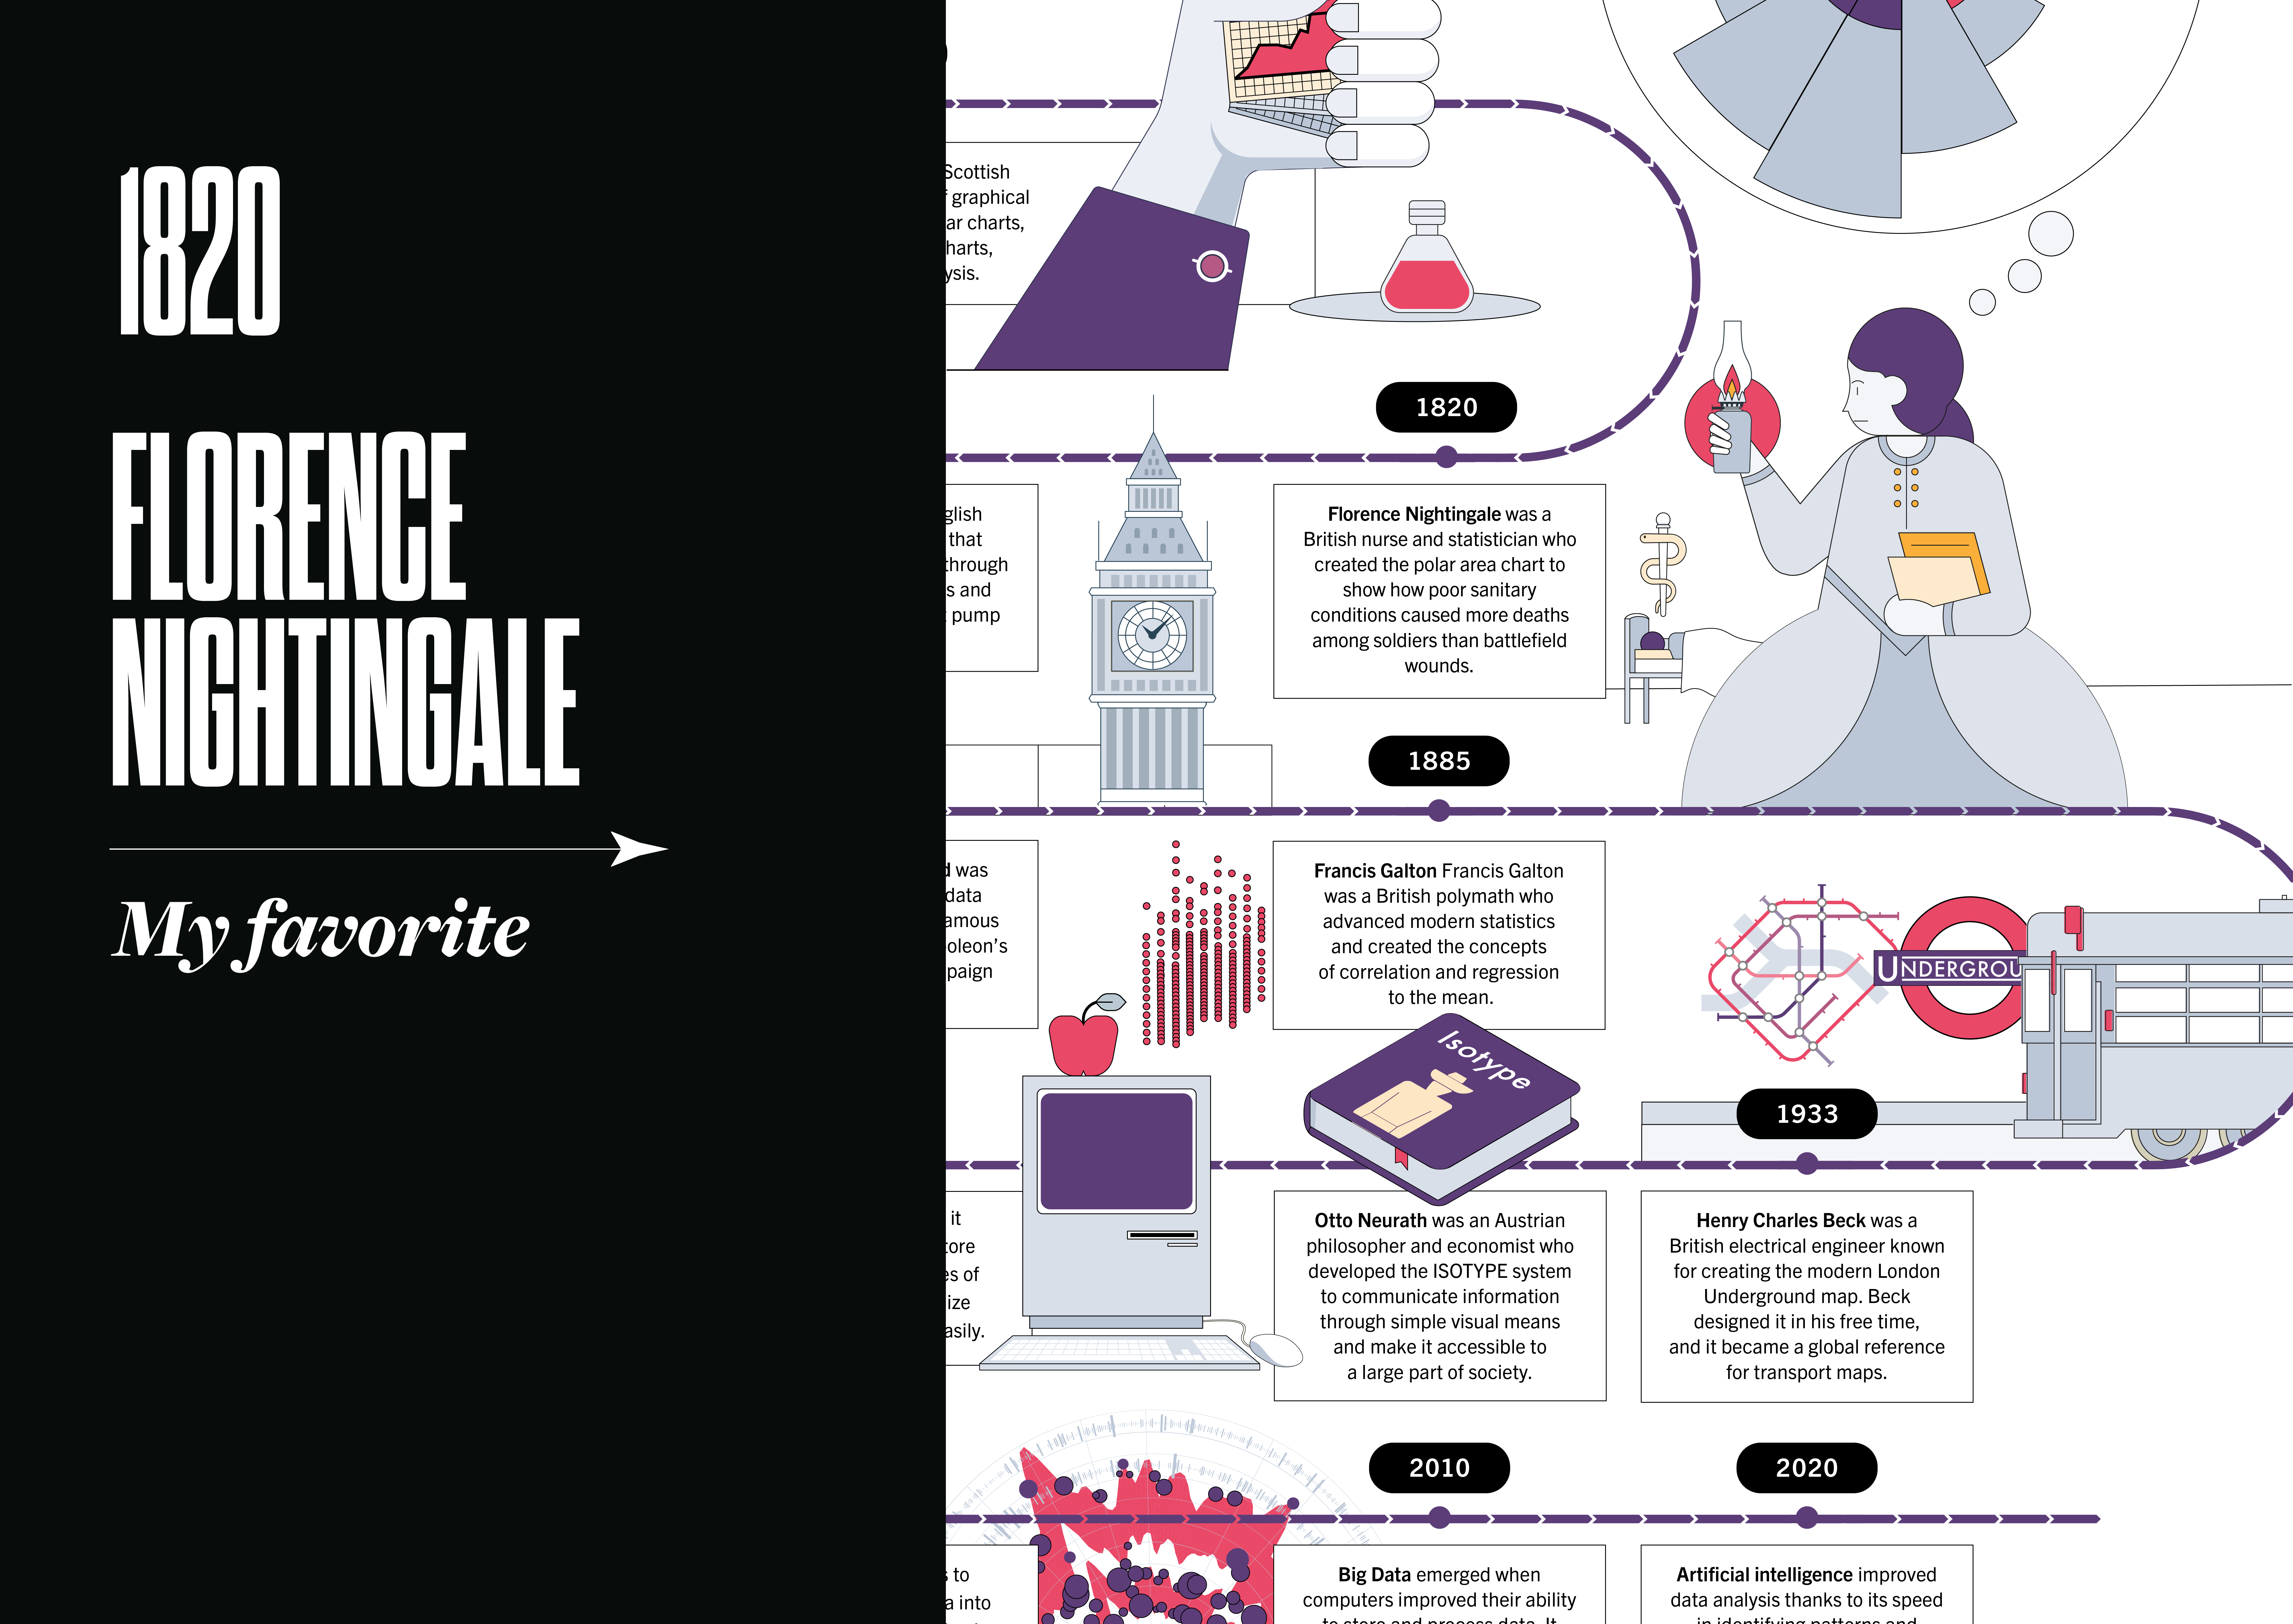
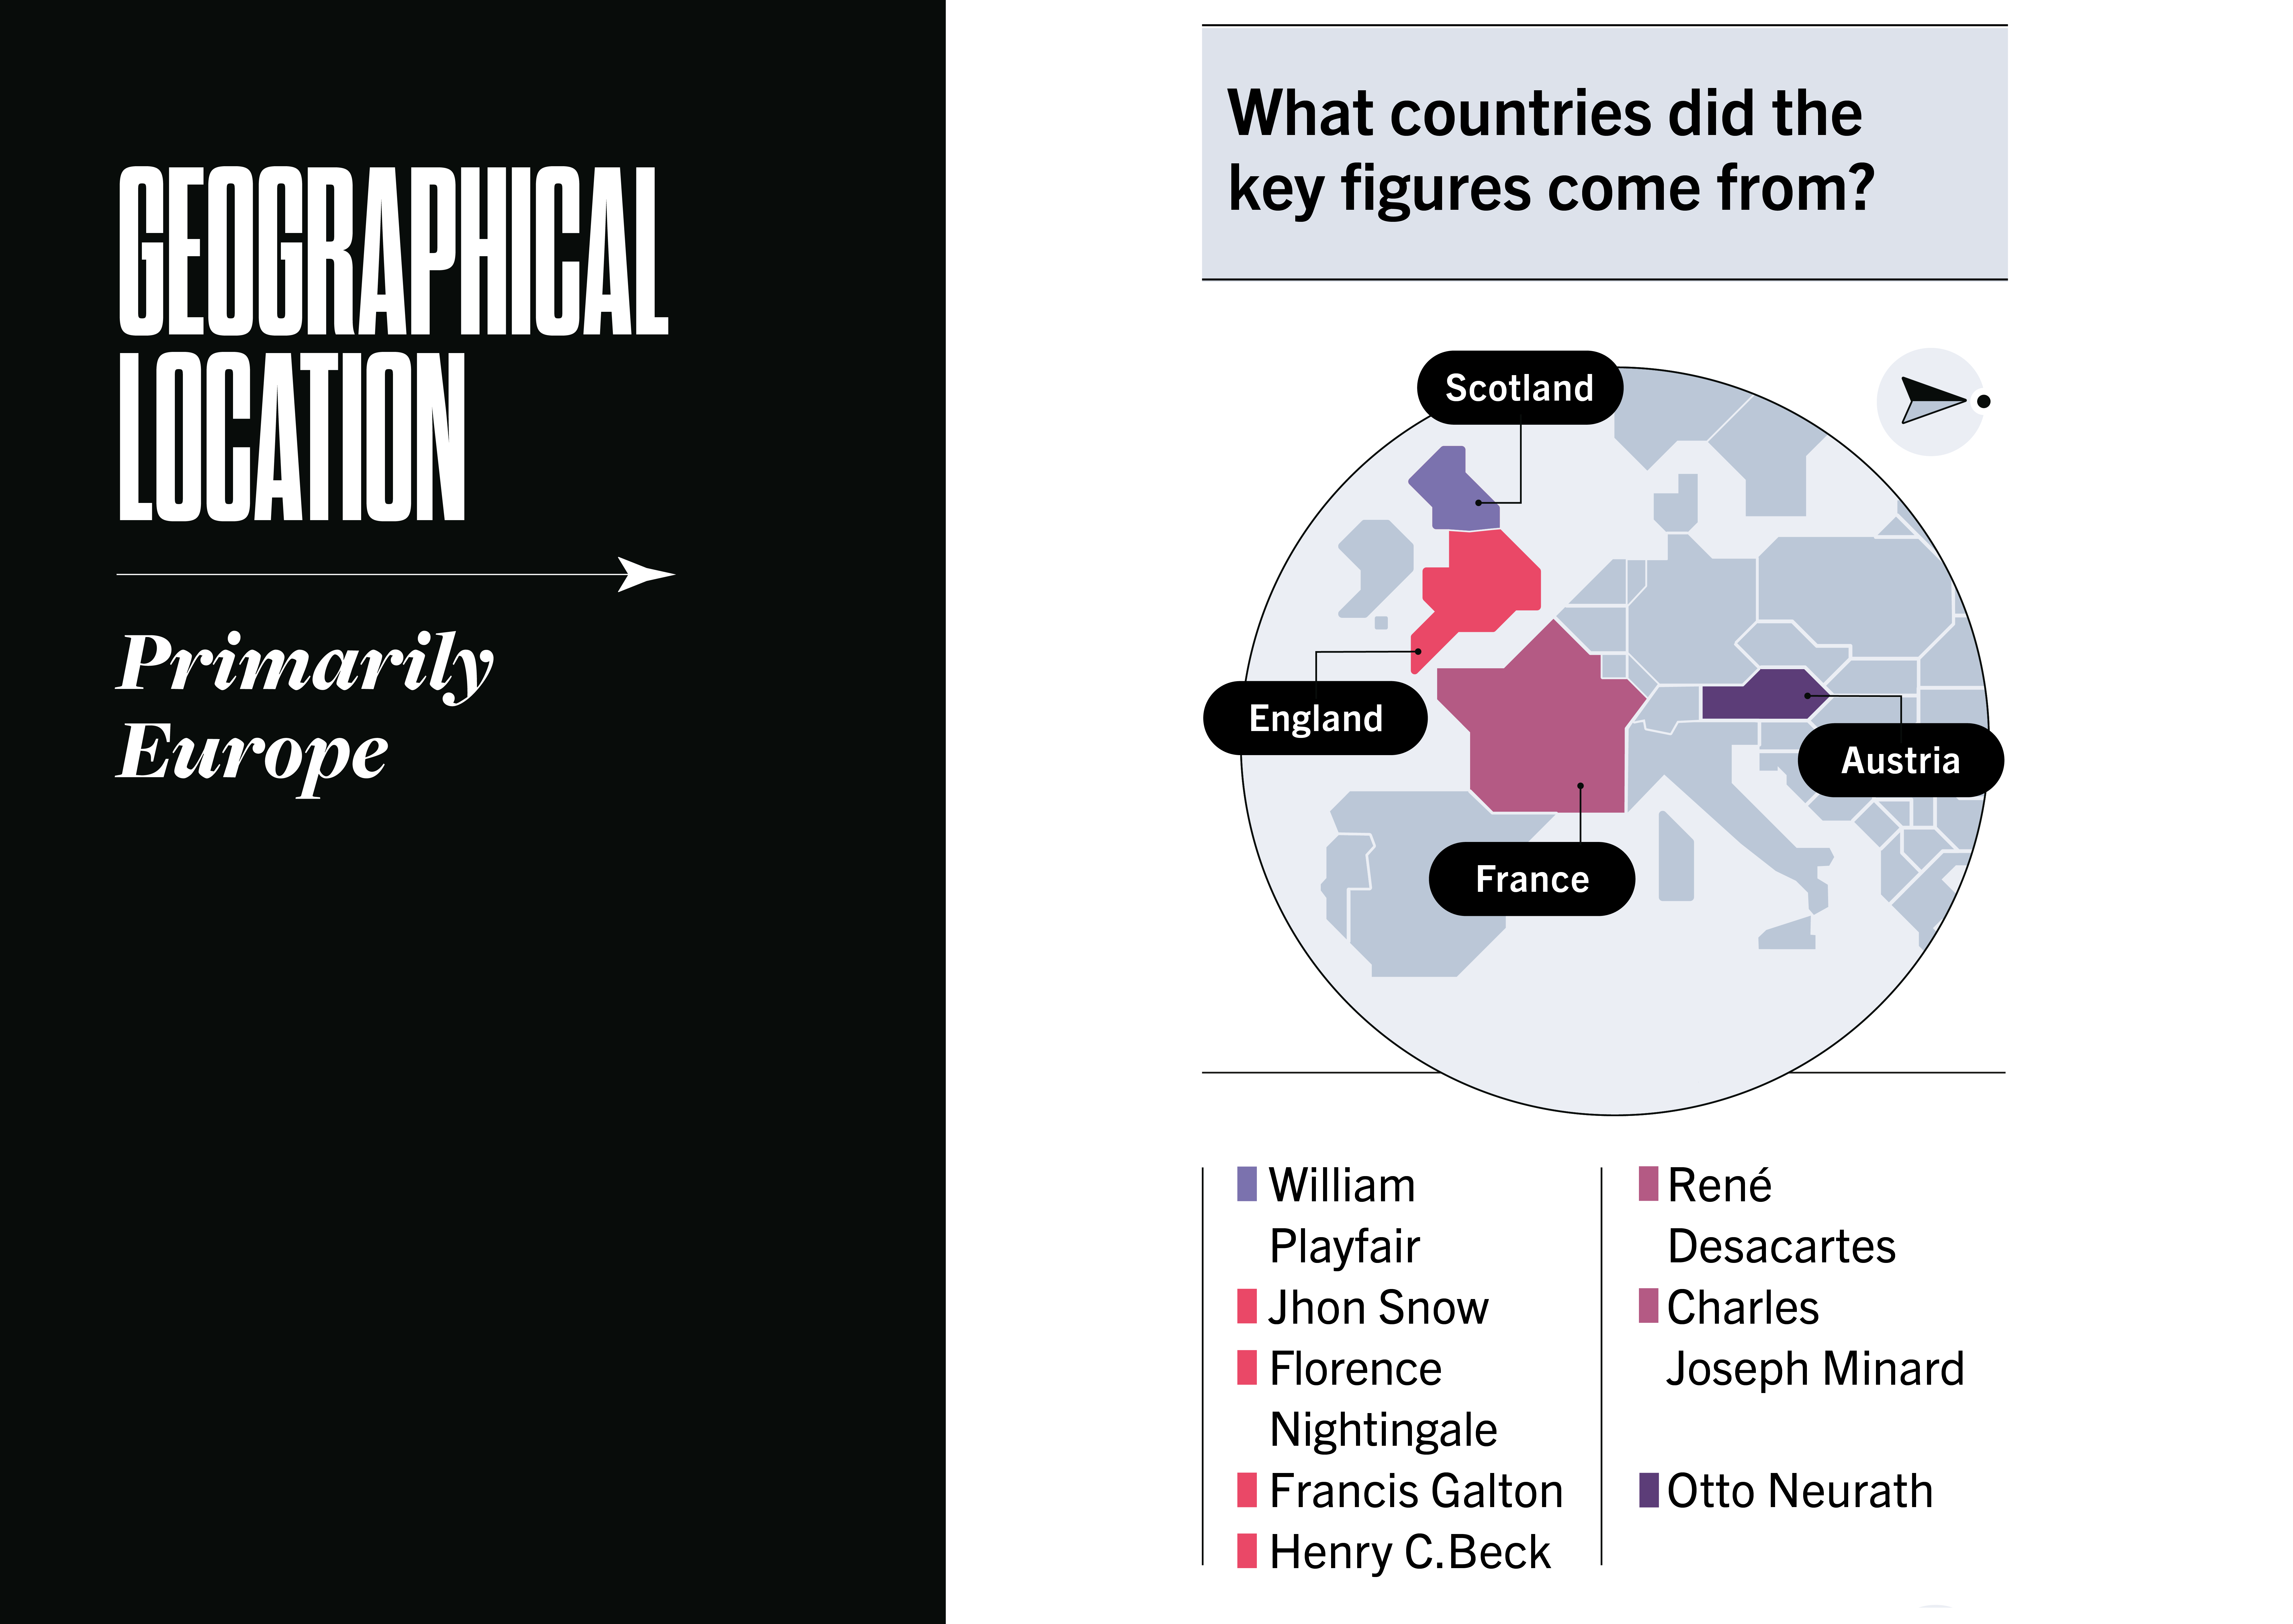
History of Data Visualization

I have always had a poor memory for details, except when it comes to images. That is why I am constantly making sketches, diagrams, or anything else that helps me see the information rather than just read it.

This gave me the idea of creating a simple visual timeline to remember some key milestones in the history of data visualisation.


So here it is: a personal project turned into an infographic, which I am now sharing in this post. It is not intended to be exhaustive or academic, but rather a friendly guide to understanding how visual thinking has helped us make sense of the world: from Descartes to Nightingale, from the first computers to artificial intelligence.

VIEW
CLOSE